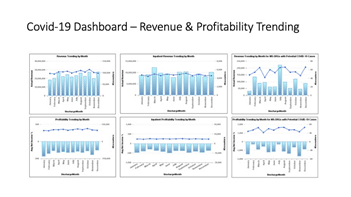
Description: This dashboard displays a graphical view of revenue and profitability trending by month for all encounters, inpatient encounters, and Covid-19 related DRGs to help healthcare professionals understand financial impacts.
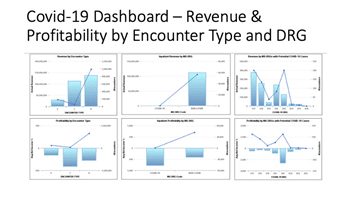
Covid-19 Dashboard Revenue & Profitability by Encounter Type and DRG
Description: This dashboard displays a graphical view of revenue and profitability by encounter type, inpatient encounters by Covid-19 related and non-related DRGs, and for Covid-19 related DRGs.
Interested in learning more?
Let’s start the conversation, contact us or go back to our Costing as a Service product page.